MID-YEAR MARKET OUTLOOK 2025 BOWLING GREEN / WARREN COUNTY
Monitoring real numbers – not projected – is critical to understanding trends and how they impact the needs and goals of my clients. Our local MLS (Multiple Listing Service) Board will release its June 2025 Market Monitor Report and Year-Over-Year report in the coming weeks to offer a detailed review of the real estate market of its service areas including Bowling Green and surrounding areas of South Central Kentucky. I monitor all the data and use it daily to help clients make the most of their buying and selling power and timing in the market.
But I find most people just want to know essential details and what it means for them so they can make good decisions. They want to know what house are selling for, what kind of market we have and how long homes stay on the market in our community today and expected for the immediate future. And while there are many parallels between our local and the national market, real estate is hyperlocal. So using my brokerage’s Keller Williams First Choice Realty’s Total Market Overview for BG/WC (KWFCR TMO BGWC), here is a snapshot of the most recent data and a Mid-Year Market Outlook 2025 for Bowling Green / Warren County to help explain what it all means.
Housing Inventory
First, a quick reminder “inventory” is the number of months it would take to sell all the homes actively for sale on the market at the current rate of sale in the MLS. Properties that are pending or under contract are still in motion and can return to market if the contract breaks down, so they remain in supply until the transaction closes. Six (6) months of inventory is considered “balanced.” More than 6 months indicates advantages to buyers or a “Buyers’ Market.” Less than 6 months indicates advantages to sellers or a “Seller’s Market.” The further away from the 6 months, the stronger the advantage.
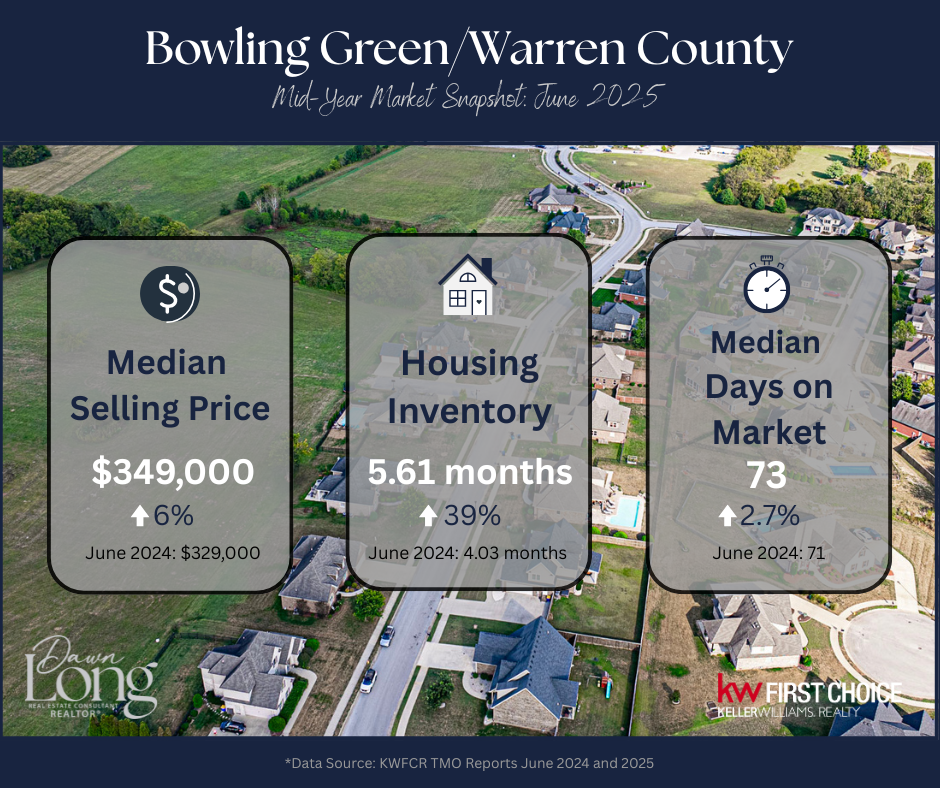
Inventory for BG/WC has been steadily increasing over the past year and was 5.61 months on 6/1/25. It was 4.03 months at the end of May and 4.68 months in December. While 1.58 months increase may not sound like a lot, that’s 38% increase year-over-year. (KWFCR TMO BGWC Reports 2025, 2024)
The market never stops and moves back and forth to find balance, so it’s also important to mention here that the range between 5 and 7 months inventory can indicates a “shift” in the market. Our local market reached 5.10 in early February and continued to edge upward. As of our last report 7/25/25, it stands at 6.10 months. Clearly the strong “Seller’s Market” of the past two years has passed at least for the time being. (KWFCR TMO BGWC Report 2/10/25; 2024, 2025)
Home Prices
Looking at year-over-year, our local market has seen a measurable increase in the price of homes. 6/1/24, the median selling price of a home in Bowling Green/Warren County was $329,000. By 6/1/25 it was $349,000. That’s a 6% increase overall. It means that if you bought the same home today that you bought a year ago, you would pay 6% more for it. Realtor.com recently reported that the national median list price for homes was $440,950 in June. Granted, they use different metrics that speak to the national housing market. But it shows just how much more opportunity home buyers and sellers have here than in other areas of the country right now. (KWFCR TMO BGWC Reports 2025, 2024)
Days on the Market
Days on the Market or DOM also fluctuate and are an indicator of how long a properly priced property (say that quickly three times!) is typically on the market before selling. Different price points can have different trends for timelines, but the common denominator is typically price. No matter the market, homes priced right sell. Homes priced too high sit. That’s why some homes go under contract quickly and others make multiple price adjustments before leaving the market with or without selling.
That said, there’s been minimal change in DOM in our local market year-over-year. 6/1/24, the median DOM in Bowling Green/Warren County was 71. On 6/1/24 it was 73. That’s a 2.7% increase year-over-year. However, by the end of June, it was 82. Our last report 7/25/25 shows 109 and what appears to be a continuing trend.
Mortgage Interest Rates
Using Freddie Mac’s Primary Mortgage Market Survey® posted every Thursday since 1971, the average 30-Yr FRM was 6.86% on 6/27/24. It was 6.91% by 1/2/25 and hit 7% briefly at 7.04% on 1/16/25. Thankfully, it has stayed under 7% since and was 6.77% on 7/26/25. Hasn’t budged much since and remains higher than most want but thankfully stable year-over-year. For the most current information visit https://www.freddiemac.com/pmms.
What It Means Today
Data available today shows our local market has been gradually shifting over the last twelve months. While home prices have increased overall, the number of properties coming to market have not outpaced the number leaving the market with or without selling. I began to see this with my clients early in November. Home prices remained high, but showings and foot traffic appeared slower for what is typically a slower fall into holiday season.
There also appears to be an increase in price adjustments and open houses since January in particular. Both have helped grow our inventory and given buyers more selection. Interest rates have continued to fluctuate without major change, making it difficult for buyers to qualify or make offers after obtaining pre-approval. National reports suggest lenders have seen an increase in number of buyer applications, but we need more MLS data to know how or if that translates into more sales here locally through June 2025.
Mid-Year Outlook
2025 has been complex so far to say the least. Locally, however, our market in Bowling Green / Warren County is relatively “balanced” and stable at the moment. Most importantly, it offers opportunities for both home buyers and sellers to move to a home that meets their needs.
Assuming no significant or unexpected events, here’s what industry experts mostly agree we can expect in the second half of 2025:
- Mortgage rates may decrease slightly as the economy stabilizes, but a return to 3% and 4% rates that some homeowners currently enjoy are not expected. 5%-7% is more realistic and in line with historical averages.
- Inventory is growing and buyers and sellers are ready to move! Affordability challenges that dominate national news are present locally, too. Buyers at all income levels are looking for every advantage to save and buy the home they need for the future.
- Home prices – although still strong – may be cooling a bit at least for the timing being. Annual appreciation level may level out, but homeowners will continue to build equity with well-maintained homes over time. Properties that are well prepared and well-priced for our local market will bring the best return when it’s time to sell.
Final Thoughts
The market never stops, and buyers and sellers find keeping up with all the constantly moving parts is a lot to digest. But one thing never seems to change: We must choose from the options before us. So if you are ready to move, your best bet is to partner with a trusted professional Realtor® who keeps up and understands it all and will help you make the most of your time, resources and options today.
Please reach out to me at dawnlong@sckyrealestate.com with any questions. I’m happy to listen and discuss how all this impacts you and your goals for 2025 and beyond. If you’re still with me at this point, we should talk soon!


Add A Comment